Overview
Teaching: 5 min Exercises: 15 minQuestions
What kind of scientific question does a stacked area chart address?
How do I generate a stacked area chart with
ggplot2?Objectives
To generate a stacked area chart using
ggplot2
Let students walk through decision making steps from question to chart.
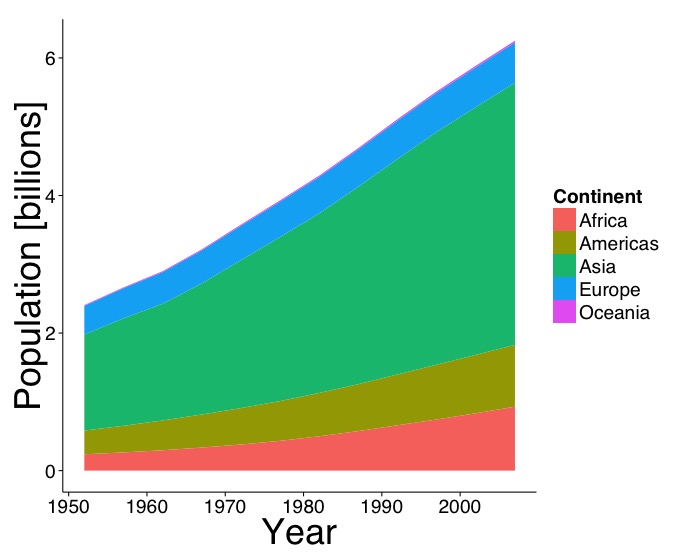
- “How has the composition of the world population among continents changed from 1952-2007?”
- Composition changing over time
- Stacked area chart
Implement faceted table of histograms.
geom_line(),geom_area()guide_legend()
Chart Improvement Challenge
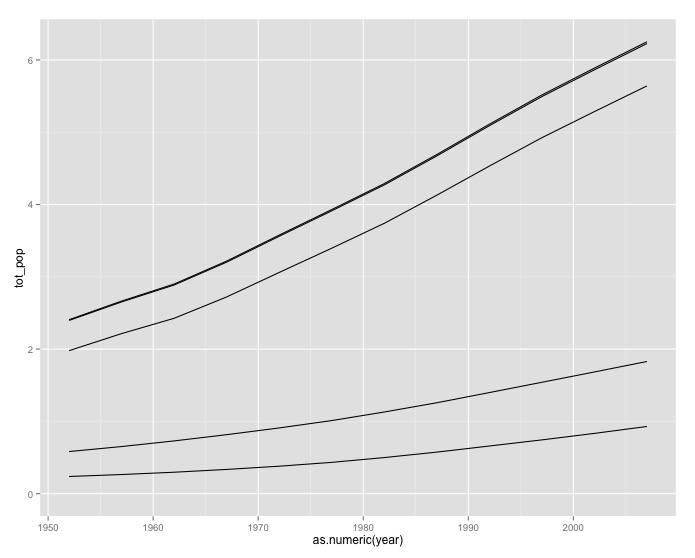
Here is a incomplete (or bad) example of the chart we are going for. Modify the code to a publication quality stacked area chart.
total_pop_continent<- pop_by_continent %>%
  group_by(continent, year) %>%
  summarize(tot_pop = sum(population)/1000000000)

ggplot(total_pop_continent, aes(as.numeric(year), tot_pop,
       group = continent)) +
  geom_line(position = "stack")
Output Solution
Code Solution
ggplot(total_pop_continent, aes(as.numeric(year), tot_pop,
       fill = continent)) +
  geom_area() +
  labs(x = "Year", y = "Population [billions]",
       fill = "Continent") +
  theme_classic(base_size = 24, base_family = "Helvetica") +
  theme(axis.title = element_text(size = 36))
Key Points
Stacked area charts represent a composition changing over time.