Overview
Teaching: 5 min Exercises: 5 minQuestions
What is tidy data structure?
How do I use
tidyrto restructure messy data?Objectives
To understand the importance of tidy data structure
To tidy our data in preparation for the final figure
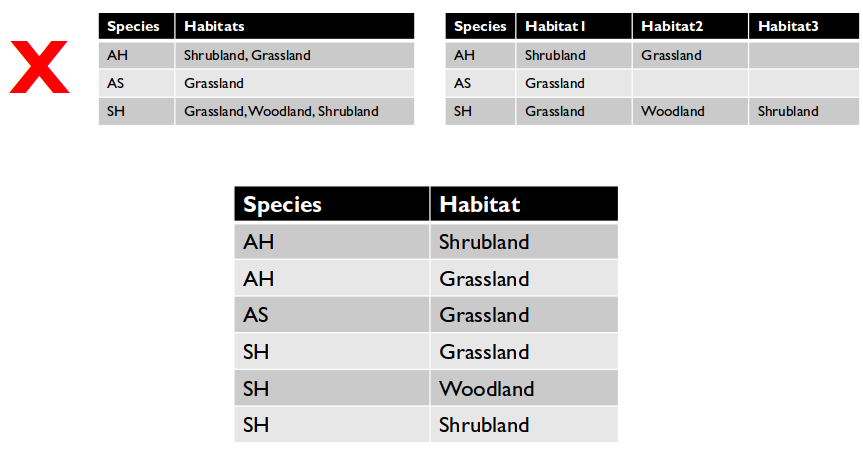
Tidy data structure rules:
- Order doesn’t matter
- No duplicate rows
- Every cell contains one value
- One column per type of information
- No redundant information
Restructure tables with messy data.
Important tidyr functions:
- gather()
- separate()
Gapminder data time series is stored cross-tabulated.
tidyrFill-in ChallengeFill in the missing pieces of the following code to generate a tidy data table.
pop_by_continent <- ________ %>%
  gather(year, population, ________) %>%
  separate(________, c("pop", "year"), sep = "_") %>%
  select(continent, country, ________, ________)
Output Solution
> str(pop_by_continent)
'data.frame':	1704 obs. of  4 variables:
 $ continent : Factor w/ 5 levels "Africa","Americas",..: 1 1 1 1 1 1 1 1 1 1 ...
 $ country   : Factor w/ 142 levels "Afghanistan",..: 3 4 11 14 17 18 20 22 23 27 ...
 $ year      : chr  "1952" "1952" "1952" "1952" ...
 $ population: num  9279525 4232095 1738315 442308 4469979 ...

> head(pop_by_continent)
  continent      country year population
1    Africa      Algeria 1952    9279525
2    Africa       Angola 1952    4232095
3    Africa        Benin 1952    1738315
4    Africa     Botswana 1952     442308
5    Africa Burkina Faso 1952    4469979
6    Africa      Burundi 1952    2445618
Code Solution
pop_by_continent <- data %>%
 gather(year, population, pop_1952:pop_2007) %>%
 separate(year, c("pop", "year"), sep = "_") %>%
 select(continent, country, year, population)
dplyrReview Fill-in ChallengeFill in the missing pieces of the following code to filter data for 2007.
pop_2007 <- filter(________)Output Solution
> str(pop_2007)
'data.frame':	142 obs. of  4 variables:
 $ continent : Factor w/ 5 levels "Africa","Americas",..: 1 1 1 1 1 1 1 1 1 1 ...
 $ country   : Factor w/ 142 levels "Afghanistan",..: 3 4 11 14 17 18 20 22 23 27 ...
 $ year      : chr  "2007" "2007" "2007" "2007" ...
 $ population: num  33333216 12420476 8078314 1639131 14326203 ...

> head(pop_2007)
  continent      country year population
1    Africa      Algeria 2007   33333216
2    Africa       Angola 2007   12420476
3    Africa        Benin 2007    8078314
4    Africa     Botswana 2007    1639131
5    Africa Burkina Faso 2007   14326203
6    Africa      Burundi 2007    8390505
Code Solution
pop_2007 <- filter(pop_by_continent, year==2007)
Key Points
Tidy data has one value per cell and all similar values in a single column.