Overview
Teaching: 10 min Exercises: 10 minQuestions
What kind of scientific question does a bubble chart address?
How do I generate a bubble chart with
ggplot2?Objectives
To generate a bubble chart using
ggplot2
Lead students to walk through decision making steps from question to chart.
- “What is the relationship of GDP per capita, life expectancy, and population across the world per country in 2007?”
- Relationship with three variables (at least two are continuous)
- Bubble Chart
Implement bubble chart.
geom_point()geom_smooth()scale_manual()
Bubble Chart Sort and Fill-in Challenge
Sort and fill in the missing pieces of the following code to generate a bubble chart.
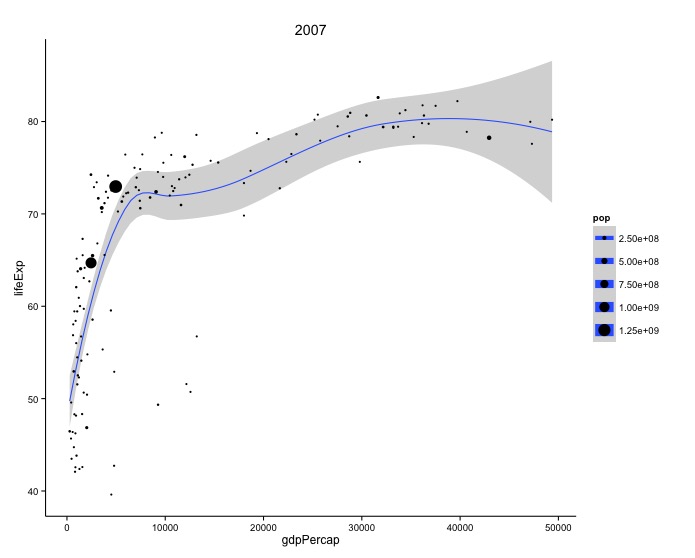
ggplot(data, aes(x = ________, y = ________, size = pop_2007)) +
geom_point() +
theme_classic()
geom_smooth() +
labs(x = ________, y = ________, size = "pop", title = "2007") +
Output Solution
Code Solution
ggplot(data, aes(x = gdpPercap_2007, y = lifeExp_2007, size = pop_2007)) +
  geom_smooth() +
  geom_point() +
  labs(x = "gdpPercap", y = "lifeExp", size = "pop", title = "2007") +
  theme_classic()
Publication Quality Bubble Chart Fill-in Challenge
Fill in the missing pieces of the following code to generate a publication quality bubble chart.
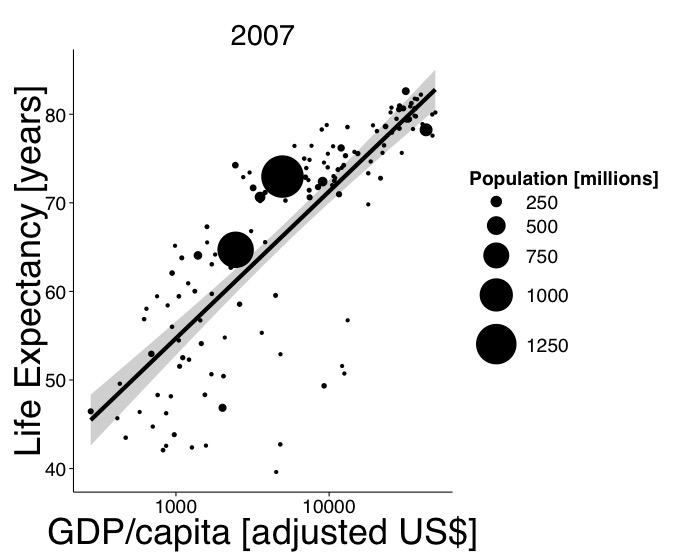
ggplot(data, aes(________)) +
  geom_smooth(method = ________, color = "black", size = 2) +
  geom_point() +
  scale_size(range = c(________)) +
  scale_x_log10() +
  labs(x = "GDP/capita [adjusted US$]", y = "Life Expectancy [years]",
       size = "Population [millions]", title = "2007") +
  theme_classic(________) +
  theme(axis.title = ________)
Output Solution
Code Solution
ggplot(data, aes(x = gdpPercap_2007, y = lifeExp_2007,
                 size = pop_2007/1000000)) +
  geom_smooth(method = "lm", color = "black", size = 2) +
  geom_point() +
  scale_size(range = c(2, 20)) +
  scale_x_log10() +
  labs(x = "GDP/capita [adjusted US$]", y = "Life Expectancy [years]",
       size = "Population [millions]", title = "2007") +
  theme_classic(base_size = 24, base_family = "Helvetica") +
  theme(axis.title = element_text(size = 36))
Key Points
Bubble charts represent a relationship with three variables