Overview
Teaching: 5 min Exercises: 15 minQuestions
What kind of scientific question does a faceted table of charts address?
How do I generate a faceted table with
ggplot2?Objectives
To generate a faceted table of histograms using
ggplot2
Build student independence to walk through decision making steps from question to chart.
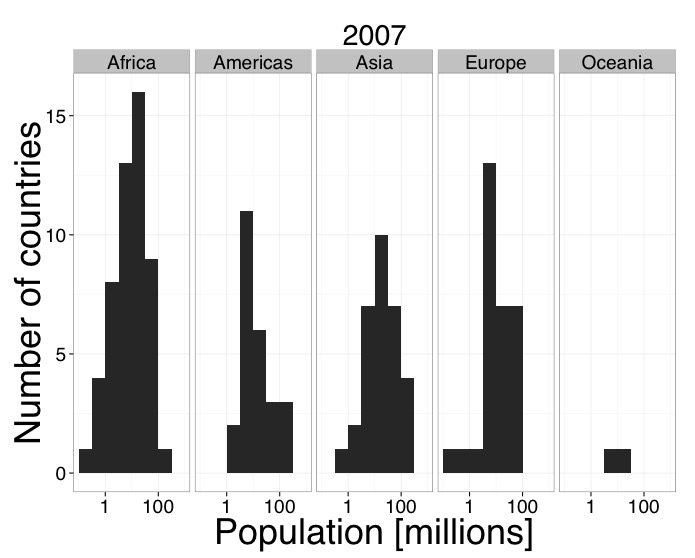
- “How was the world population distributed among continents in 2007?”
- Comparison among many items or categories
- Faceted table of histogram bar charts
Implement faceted table of histograms.
facet_grid()lims()
Fix the Faceted Table Code Challenge
Fix the code to generate a faceted table of histograms.
ggplot(pop_2007, aes(year)) +
  geom_histogram(binwidth=0.5) +
  scale_x_log10(limits = c(0.1, 10))
  facet_grid(continent ~ .) +
  labs(x = Population [millions], y = Number of countries,
       title = "2007") +
  theme_bw(base_size = 42, base_family = "Script") +
  theme(axis.title=element_text(size=36))
Output Solution
Code Solution
ggplot(pop_2007, aes(population/1000000)) +             # Replace aes()
 geom_histogram(binwidth=0.5) +
 scale_x_log10(limits = c(0.1, 1000)) +                 # Add +
 facet_grid(. ~ continent) +                            # Reverse ~ .
 labs(x = "Population [millions]", y = "Number of countries",
      title = "2007") +                                 # Add ""
 theme_bw(base_size = 24, base_family = "Helvetica") +  # Fix input vars
 theme(axis.title = element_text(size = 36))
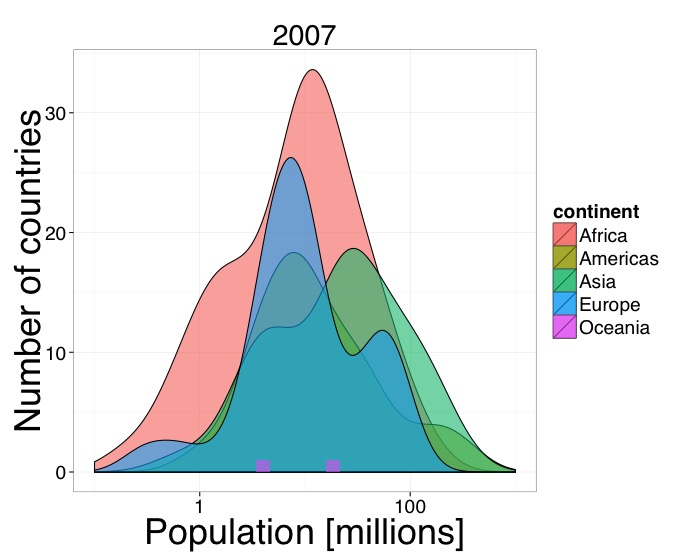
Alternate Good Charts Discussion
This is another quality solution to addressing “How was the world population distributed among continents in 2007?”
Compare and contrast the two graphic representations addressing the research question.
Grouped Density Chart Code
ggplot(pop_2007, aes(x = population/1000000, y = ..count.., fill = continent)) +
 geom_density(alpha = 0.6) +
 geom_histogram(data=filter(pop_2007, continent=="Oceania"), alpha = 0.6) +
 scale_x_log10(limits = c(0.1, 1000)) +
 labs(x = "Population [millions]", y = "Number of countries", title = "2007") +
 theme_bw(base_size = 24, base_family = "Helvetica") +
 theme(axis.title = element_text(size = 36))
Key Points
Faceted tables represent a comparison among many items or categories.
Multiple good charts can address a single scientific question.