Overview
Teaching: 10 min Exercises: 10 minQuestions
What kind of scientific question does a line histogram address?
How do I generate a line histogram with
ggplot2?Objectives
To generate a line histogram using
ggplot2
Walk through decision making steps from question to chart.
- “How was the population of Africa distributed across the continent by country in 2007?”
- Single variable distribution with many points
- Line Histogram
Implement line histogram.
geom_histogram()geom_density()
Line Histogram Fill-in Challenge
Fill in the missing pieces of the following code to generate a line histogram.
ggplot(Africa, aes(________, ..count..)) +
  geom_density() ________
  labs(x = "Log10(________)", y = "Count")
Output Solution
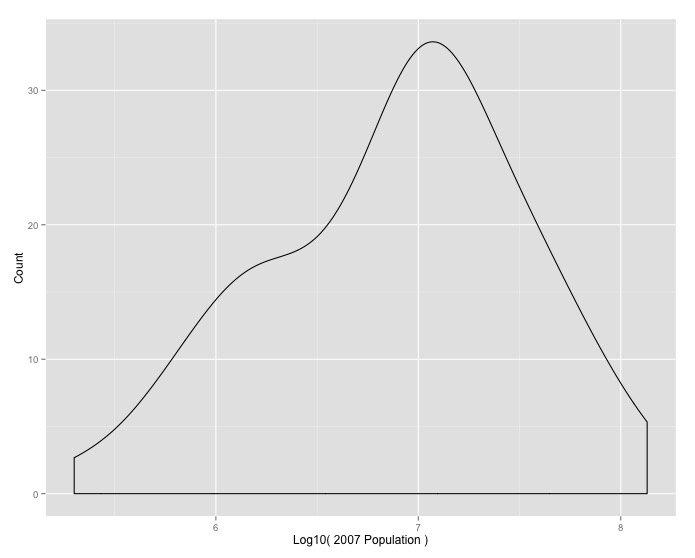
Code Solution
ggplot(Africa, aes(log10(pop_2007), ..count..)) +
 geom_density() +
 labs(x = "Log10( 2007 Population )", y = "Count")
Key Points
Line histograms represent a single variable distributions with many points.