Repeating With Loops
Last updated on 2025-01-08 | Edit this page
Overview
Questions
- How can I repeat the same operations on multiple values?
Objectives
- Explain what a for loop does.
- Correctly write for loops that repeat simple commands.
- Trace changes to a loop variable as the loops runs.
- Use a for loop to process multiple files
Recall that we have to do this analysis for every one of our dozen datasets, and we need a better way than typing out commands for each one, because we’ll find ourselves writing a lot of duplicate code. Remember, code that is repeated in two or more places will eventually be wrong in at least one. Also, if we make changes in the way we analyze our datasets, we have to introduce that change in every copy of our code. To avoid all of this repetition, we have to teach MATLAB to repeat our commands, and to do that, we have to learn how to write loops.
Suppose we want to print each character in the word “lead” on a line
of its own. One way is to use four disp statements:
MATLAB
%LOOP_DEMO   Demo script to explain loops

word = 'lead';

disp(word(1))
disp(word(2))
disp(word(3))
disp(word(4))
OUTPUT
l
e
a
d
But this is a bad approach for two reasons:
It doesn’t scale: if we want to print the characters in a string that’s hundreds of letters long, we’d be better off typing them in.
It’s fragile: if we change
wordto a longer string, it only prints part of the data, and if we change it to a shorter one, it produces an error, because we’re asking for characters that don’t exist.
MATLAB
%LOOP_DEMO   Demo script to explain loops

word = 'tin';

disp(word(1))
disp(word(2))
disp(word(3))
disp(word(4))
ERROR
error: A(I): index out of bounds; value 4 out of bound 3There’s a better approach:
MATLAB
%LOOP_DEMO   Demo script to explain loops

word = 'lead';

for letter = 1:4
    disp(word(letter))
end
OUTPUT
l
e
a
d
This improved version uses a for loop to repeat an operation—in this case, printing to the screen—once for each element in an array.
The general form of a for loop is:
for variable = collection
    do things with variable
end
The for loop executes the commands in the loop body for every value in the
array collection. This value is called the loop variable, and we can call
it whatever we like. In our example, we gave it the name
letter.
We have to terminate the loop body with the end keyword,
and we can have as many commands as we like in the loop body. But, we
have to remember that they will all be repeated as many times as there
are values in collection.
Our for loop has made our code more scalable, and less fragile. There’s still one little thing about it that should bother us. For our loop to deal appropriately with shorter or longer words, we have to change the first line of our loop by hand:
MATLAB
%LOOP_DEMO   Demo script to explain loops

word = 'tin';

for letter = 1:3
    disp(word(letter))
end
OUTPUT
t
i
n
Although this works, it’s not the best way to write our loop:
We might update
wordand forget to modify the loop to reflect that change.We might make a mistake while counting the number of letters in
word.
Fortunately, MATLAB provides us with a convenient function to write a better loop:
MATLAB
%LOOP_DEMO   Demo script to explain loops

word = 'aluminum';

for letter = 1:length(word)
    disp(word(letter))
end
OUTPUT
a
l
u
m
i
n
u
m
This is much more robust code, as it can deal identically with words of arbitrary length. Loops are not only for working with strings, they allow us to do repetitive calculations regardless of data type. Here’s another loop that calculates the sum of all even numbers between 1 and 10:
MATLAB
%LOOP_DEMO   Demo script to explain loops

total = 0;
for even_number = 2 : 2 : 10
    total = total + even_number;
end

disp('The sum of all even numbers between 1 and 10 is:')
disp(total)
It’s worth tracing the execution of this little program step by step.
The debugger
We can use the MATLAB debugger to trace the execution of a program.
The first step is to set a break point by clicking
just to the right of a line number on the - symbol. A red
circle will appear — this is the break point, and when we run the
script, MATLAB will pause execution at that line.
A green arrow appears, pointing to the next line to be run. To
continue running the program one line at a time, we use the
step button.
We can then inspect variables in the workspace or by hovering the
cursor over where they appear in the code, or get MATLAB to evaluate
expressions in the command window (notice the prompt changes to
K>>).
This process is useful to check your understanding of a program, in order to correct mistakes.
This process is illustrated below: 
Since we want to sum only even numbers, the loop index
even_number starts at 2 and increases by 2 with every
iteration. When we enter the loop, total is zero - the
value assigned to it beforehand. The first time through, the loop body
adds the value of the first even number (2) to the old value of
total (0), and updates total to refer to that
new value. On the next loop iteration, even_number is 4 and
the initial value of total is 2, so the new value assigned
to total is 6. After even_number reaches the
final value (10), total is 30; since this is the end of the
range for even_number the loop finishes and the
disp statements give us the final answer.
Note that a loop variable is just a variable that’s being used to record progress in a loop. It still exists after the loop is over, and we can re-use variables previously defined as loop variables as well:
OUTPUT
10Performing Exponentiation
MATLAB uses the caret (^) to perform exponentiation:
OUTPUT
125You can also use a loop to perform exponentiation. Remember that
b^x is just b*b*b*… x times.
Let a variable b be the base of the number and
x the exponent. Write a loop to compute b^x.
Check your result for b = 4 and x = 5.
Incrementing with Loops
Write a loop that spells the word “aluminum,” adding one letter at a time:
OUTPUT
a
al
alu
alum
alumi
alumin
aluminu
aluminumLooping in Reverse
In MATLAB, the colon operator (:) accepts a stride or skip argument between the
start and stop:
OUTPUT
1 4 7 10OUTPUT
11 8 5 2Using this, write a loop to print the letters of “aluminum” in reverse order, one letter per line.
OUTPUT
m
u
n
i
m
u
l
aAnalyzing patient data from multiple files
We now have almost everything we need to process multiple data files
using a loop and the plotting code in our plot_patient1
script.
We still need to generate a list of data files to process, and then we can use a loop to repeat the analysis for each file.
We can use the dir command to return a structure
array containing the names of the files in the
data directory. Each element in this structure
array is a structure, containing information about
a single file in the form of named fields.
OUTPUT
files =
  12×1 struct array with fields:
    name
    folder
    date
    bytes
    isdir
    datenum
To access the name field of the first file, we can use the following syntax:
OUTPUT
inflammation-01.csvTo get the modification date of the third file, we can do:
OUTPUT
26-Jul-2015 22:24:31A good first step towards processing multiple files is to write a
loop which prints the name of each of our files. Let’s write this in a
script plot_all.m which we will then develop further:
MATLAB
%PLOT_ALL	Developing code to automate inflammation analysis

files = dir('data/inflammation-*.csv');

for i = 1:length(files)
	file_name = files(i).name;
	disp(file_name)
endOUTPUT
inflammation-01.csv
inflammation-02.csv
inflammation-03.csv
inflammation-04.csv
inflammation-05.csv
inflammation-06.csv
inflammation-07.csv
inflammation-08.csv
inflammation-09.csv
inflammation-10.csv
inflammation-11.csv
inflammation-12.csv
Another task is to generate the file names for the figures we’re
going to save. Let’s name the output file after the data file used to
generate the figure. So for the data set
inflammation-01.csv we will call the figure
inflammation-01.png. We can use the replace
command for this purpose.
The syntax for the replace command is like this:
So for example if we have the string big_shark and want
to get the string little_shark, we can execute the
following command:
OUTPUT
little_sharkRecall that we’re saving our figures to the results
directory. The best way to generate a path to a file in MATLAB is by
using the fullfile command. This generates a file path with
the correct separators for the platform you’re using (i.e. forward slash
for Linux and macOS, and backslash for Windows). This makes your code
more portable which is great for collaboration.
Putting these concepts together, we can now generate the paths for the data files, and the image files we want to save:
MATLAB
%PLOT_ALL	Developing code to automate inflammation analysis

files = dir('data/inflammation-*.csv');

for i = 1:length(files)
    file_name = files(i).name;

    % Generate string for image name
    img_name = replace(file_name, '.csv', '.png');

    % Generate path to data file and image file
    file_name = fullfile('data', file_name);
    img_name = fullfile('results',img_name);

    disp(file_name)
    disp(img_name)
end
OUTPUT
data/inflammation-01.csv
results/inflammation-01.png
data/inflammation-02.csv
results/inflammation-02.png
data/inflammation-03.csv
results/inflammation-03.png
data/inflammation-04.csv
results/inflammation-04.png
data/inflammation-05.csv
results/inflammation-05.png
data/inflammation-06.csv
results/inflammation-06.png
data/inflammation-07.csv
results/inflammation-07.png
data/inflammation-08.csv
results/inflammation-08.png
data/inflammation-09.csv
results/inflammation-09.png
data/inflammation-10.csv
results/inflammation-10.png
data/inflammation-11.csv
results/inflammation-11.png
data/inflammation-12.csv
results/inflammation-12.png
We’re now ready to modify plot_all.m to actually process
multiple data files:
MATLAB
%PLOT_ALL   Print statistics for all patients.
%           Save plots of statistics to disk.

files = dir('data/inflammation-*.csv');

% Process each file in turn
for i = 1:length(files)
    file_name = files(i).name;

    % Generate strings for image names:
    img_name  = replace(file_name, '.csv', '.png');

    % Generate path to data file and image file
    file_name = fullfile('data', file_name);
    img_name  = fullfile('results', img_name);

    patient_data = readmatrix(file_name);

    % Create figures
    figure('visible', 'off')

    subplot(2, 2, 1)
    plot(mean(patient_data, 1))
    title('Average')
    ylabel('Inflammation')
    xlabel('Day')

    subplot(2, 2, 2)
    plot(max(patient_data, [], 1))
    title('Max')
    ylabel('Inflammation')
    xlabel('Day')

    subplot(2, 2, 3)
    plot(min(patient_data, [], 1))
    title('Min')
    ylabel('Inflammation')
    xlabel('Day')

    print(img_name, '-dpng')
    close()
end
We run the modified script using its name in the Command Window:
The first three figures output to the results directory
are as shown below:
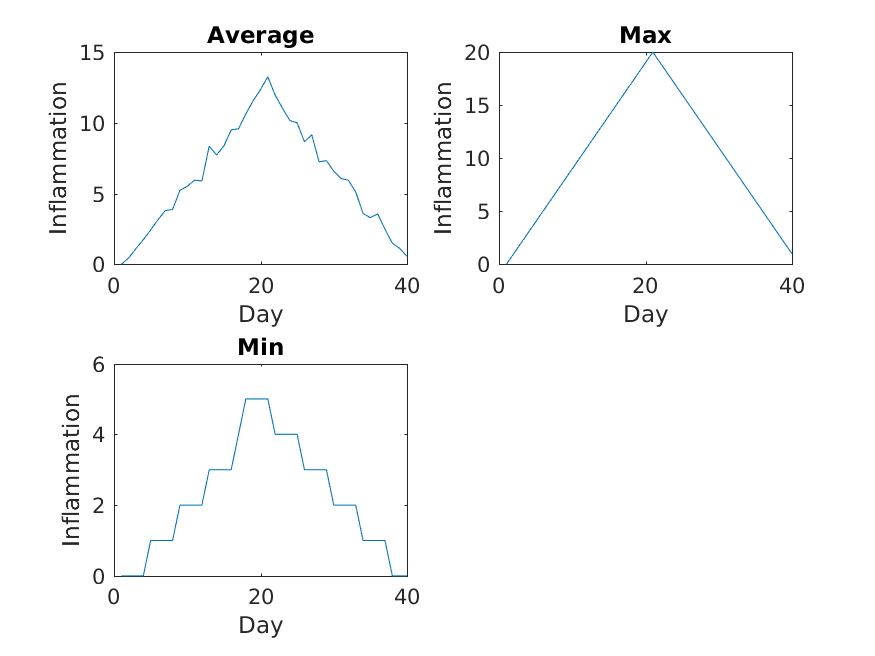
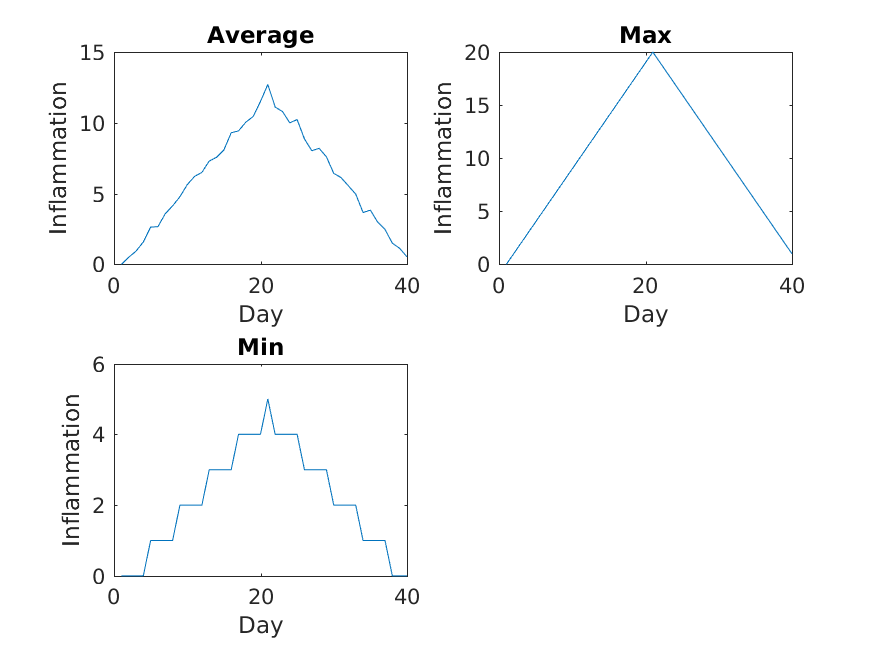

Sure enough, the maxima of these data sets show exactly the same ramp as the first, and their minima show the same staircase structure.
We’ve now automated the analysis and have confirmed that all the data files we have looked at show the same artifact. This is what we set out to test, and now we can just call one script to do it. With minor modifications, this script could be re-used to check all our future data files.
- Use
forto create a loop that repeats one or more operations.