Overview
Teaching: 30 min
Exercises: 45 minQuestions
How can we describe the difference in learning between a novice and expert?
How is memory a limiting factor in learning?
Objectives
Explain how key aspects of expert behavior are results of cognitive differences between experts and competent practitioners.
Construct a concept map for a short lesson showing the lesson’s key ideas and the relationships between them.
Returning to educational psychology, we now discuss what distinguishes expertise from earlier stages of learning, how expertise can be helpful and harmful, and then describe concept maps, a tool that can help expose expertise.
Connectivity
An earlier topic described the key difference between novices and competent practitioners. What makes experts different from either? The answer is not that they know more facts: competent practitioners can memorize a lot of trivia without any noticeable improvement to their performance.
To explain the difference, imagine for a moment that we store knowledge as a graph in which facts are nodes and relationships are arcs. (This is emphatically not how our brains work, but it’s a useful metaphor.) The key difference between experts and people who are “merely competent” is that experts have many more connections, i.e., their mental models are much more densely connected.
To understand expert behavior, think about driving around a city, comparing what it’s like for the local and for the out-of-town driver.
This metaphor helps explain many observed aspects of expert behavior:
-
Experts can jump directly from a problem to its solution because there actually is a direct link between the two in their mind: where a competent practitioner would have to reason “A, B, C, D, E”, the expert can go from A to E in a single step. We call this intuition, and it isn’t always a good thing: when asked to explain her reasoning, an expert often can’t because she didn’t actually go through any intermediate steps.
In our example above, the local probably doesn’t even think about which turns they’re making on their way to the grocery store. They can drive on “autopilot” without really thinking. If someone asks them to go to a different location, they immediately know what they should do next to get to the right place.
-
Experts are frequently so familiar with their subject that they can no longer imagine what it’s like to not see the world that way. As a result, they are often less good at teaching the subject than people with less expertise who still remember what it’s like to have to learn the things. This is called expert blind spot. It can be overcome with training, but it’s part of why world-famous researchers are often poor lecturers.
The local driver will forget to tell the out-of-towner that the bridge is under construction, or that there’s always a train at 3:00, because it has been like that for years. The local driver will tell the out-of-towner to turn “where the gas station used to be”.
-
Densely-connected knowledge graphs also explains fluid representations, e.g., expert mathematicians’ ability to switch effortlessly between algebraic and geometric views of a problem.
The local driver probably can use either the names of streets or landmarks when giving directions. The out-of-towner only has street labels.
-
Finally, this metaphor also explains why experts are better at diagnosis than competent practitioners: more linkages between facts makes it easier to reason backward from symptoms to causes. (And this in turn is why asking programmers to debug during job interviews gives a more accurate impression of their ability than asking them to program.)
When the out-of-towner finally calls their local friend, saying “well, we just passed Sycamore Street and we can see a restaurant named Nellie’s Cafe”, the local can more easily figure out where the out-of-towner is, and how to get to their destination.
The J Word
Experts often betray their blind spot by using the word “just” in explanations, as in, “Oh, it’s easy, you just fire up a new virtual machine and then you just install these four patches to Ubuntu and then you just re-write your entire program in a pure functional style—no problem.” As we discuss later, the J word (also sometimes called the passive dismissive adjective) is banned in our workshops, primarily because using it gives learners the very clear signal that the instructor thinks their problem is trivial and that they therefore must be stupid.
The graph model of knowledge explains why helping learners make connections is as important as introducing them to facts. The more people you know in a group, the more likely you are to remain part of that group. Similarly, the more connections a fact has to other facts, the more likely the fact is to be remembered. This builds on our earlier idea of mental models - a mental model is a way to facilitate making connections between separate facts.
Repetition vs. Reflective Practice
The idea that ten thousand hours of practice will make someone an expert in some field is widely known, but reality is much more complex. First, practice is not doing the same thing over and over again: practice is doing similar but subtly different things, getting feedback, and then changing behavior in response to that feedback to get cumulatively better. Doing the same thing over and over again is much more likely to solidify bad habits than perfect performance.
Second, a meta-study in 2014 found that “…deliberate practice explained 26% of the variance in performance for games, 21% for music, 18% for sports, 4% for education, and less than 1% for professions.” One explanation for this variation is that deliberate practice works best when the rules for evaluating success are very stable, but is less effective when there are more factors at play.
Concept Maps
Our tool of choice to represent an expert’s knowledge graph is the concept map. A concept map is simply a picture of someone’s mental model of a domain: facts are bubbles, and connections are labelled arcs. It is important that they are labelled: saying “X and Y are related” is only helpful if we explain what the relationship is. And yes, one person’s fact may be another person’s connection, but by externalizing cognition (i.e., making thought processes and mental models visible), concept maps help spark and focus discussion.
There’s More Than One Way to Do It
Concept maps are just one way to represent our understanding of a subject. Flowcharts, decision trees, and blueprints can be even more useful in some contexts. For example, this diagram (taken from a blog post by Andrew Abela) is an excellent way to organize and present an understanding of how to choose the right kinds of chart for displaying different kinds of data.
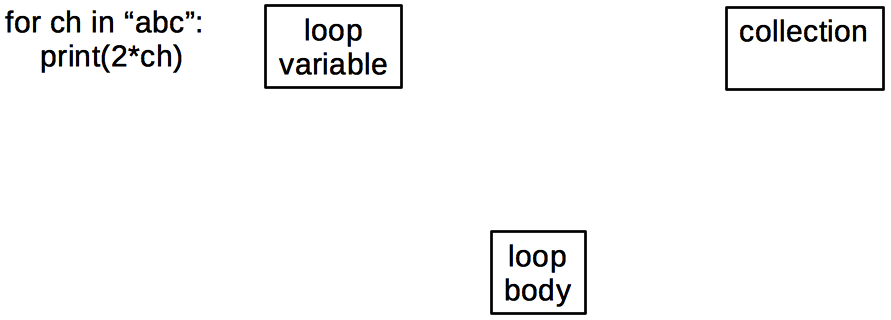
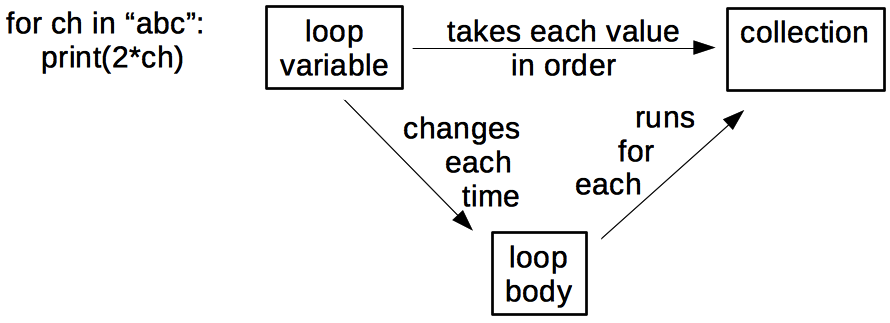
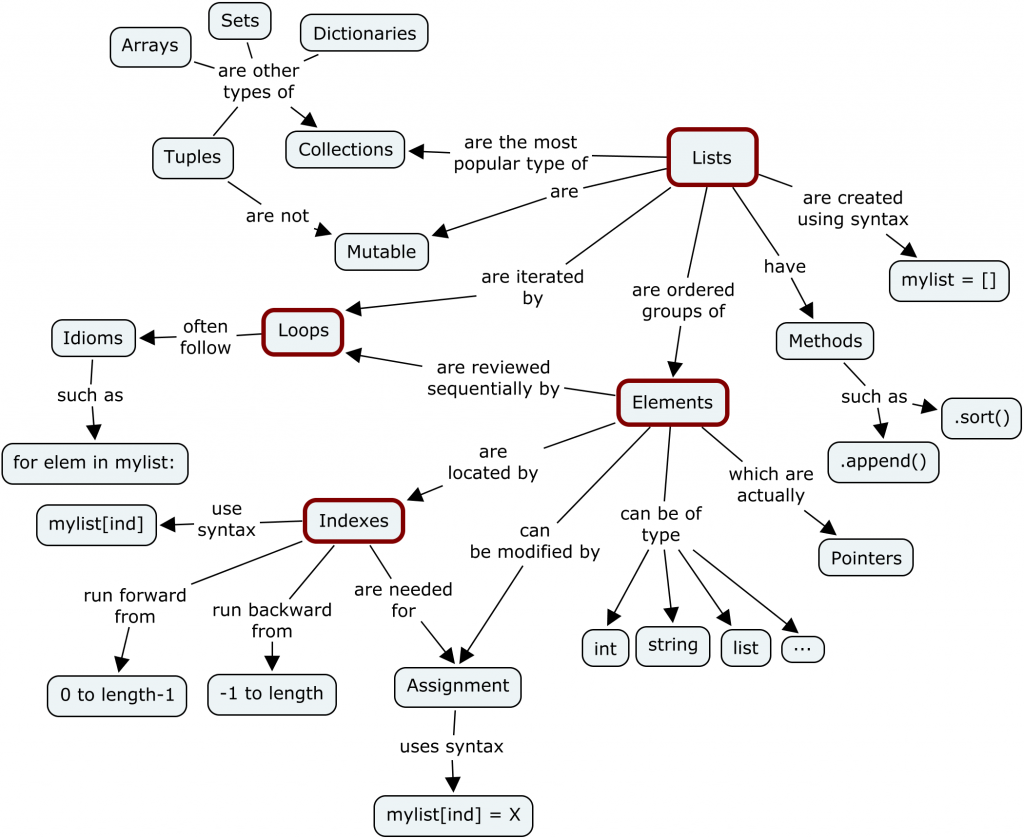
To show what concept maps look like,
consider this simple for loop in Python:
for ch in "abc":
    print(2*ch)
The three key concepts used in this loop are:
(In this case it’s easy to connect the concepts to concrete elements in the program, but that may not always be the case.) The key relationships, which are as important as the concepts themselves, are:
A quick count shows that there are actually 6 things here, not just 3, so we’re already brushing up against the limits of short-term memory. If we add two more facts to show things that are usually (but not always) true:
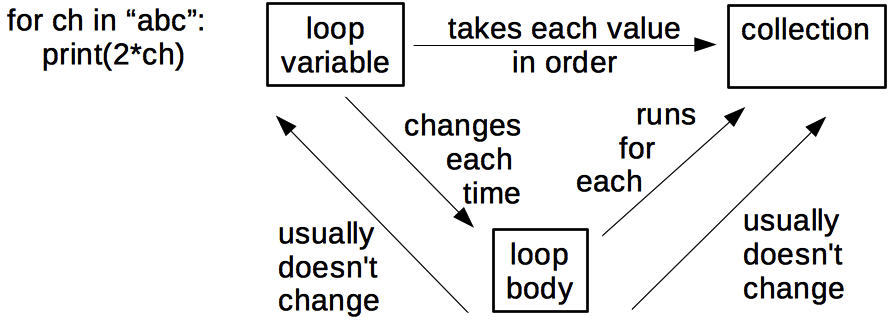
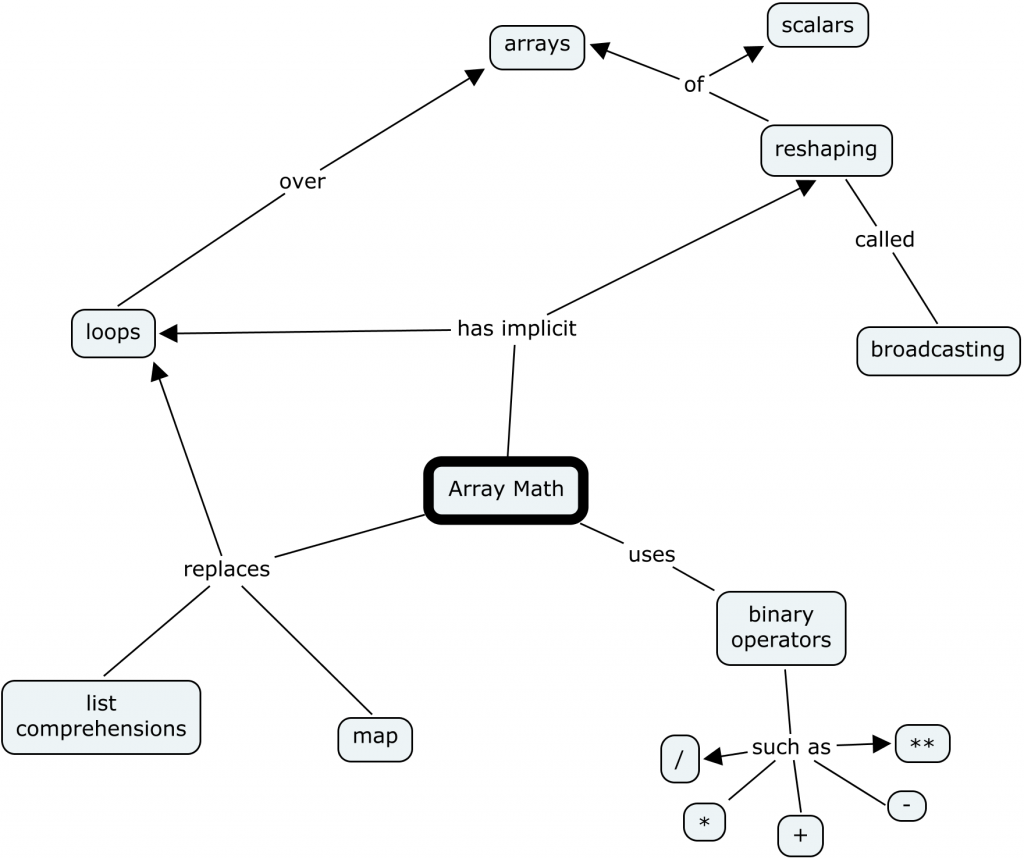
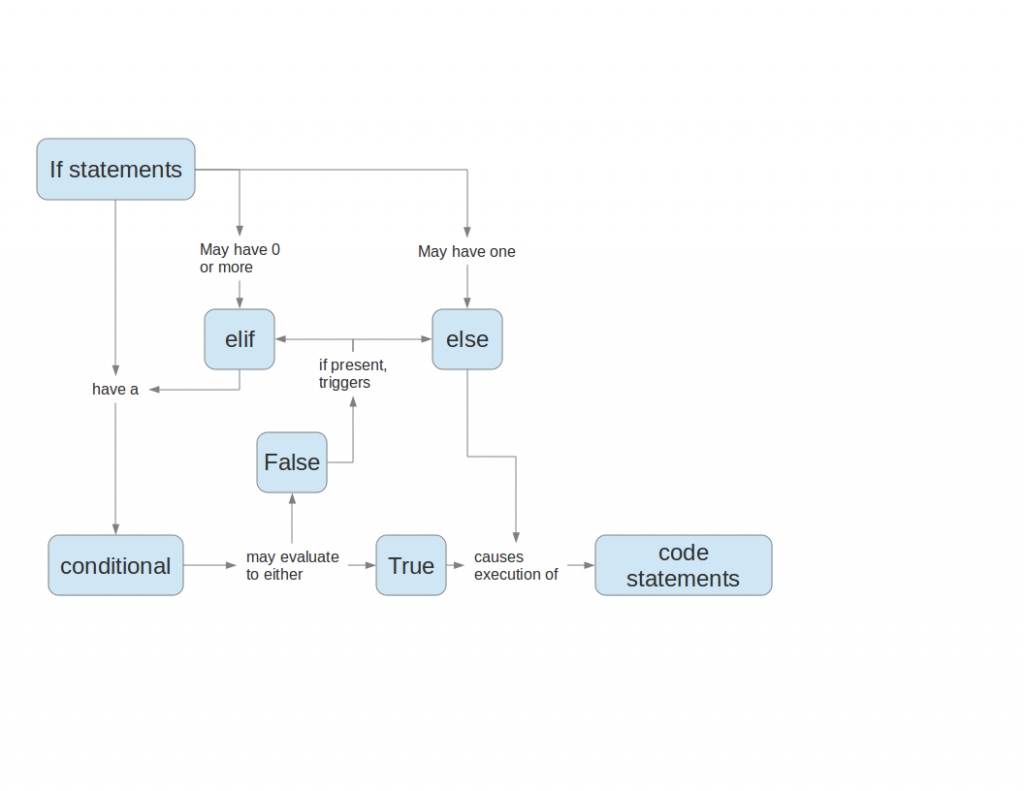
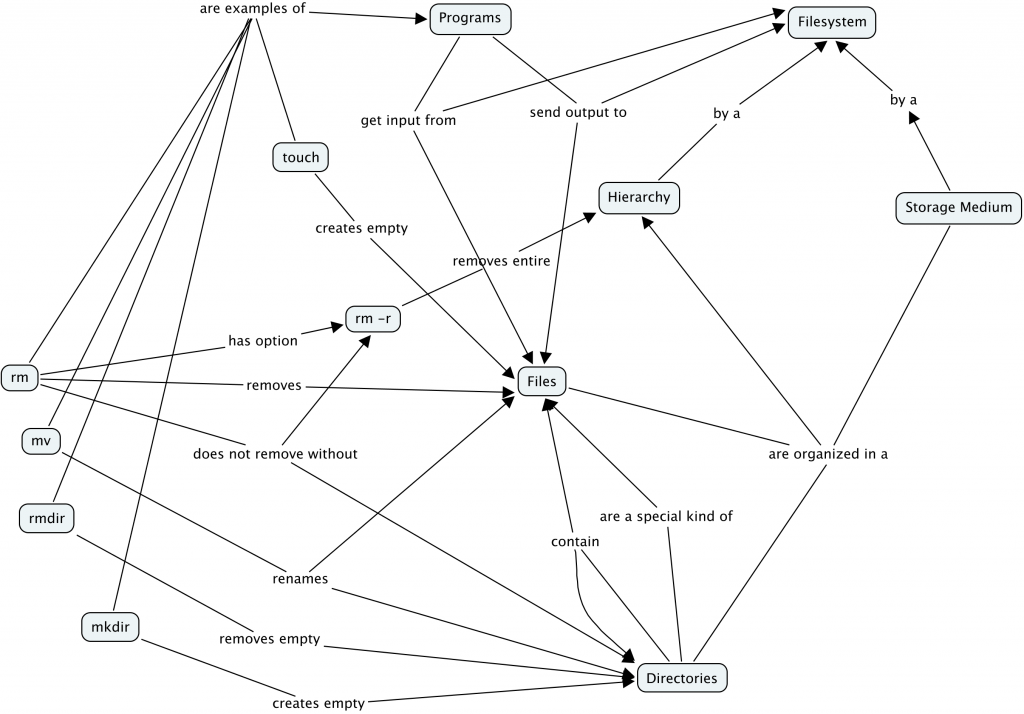
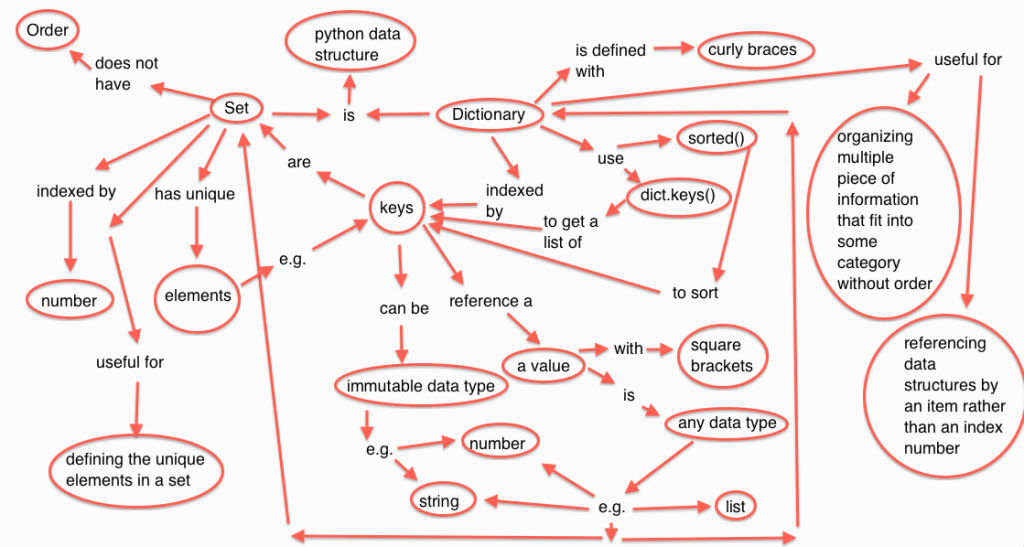
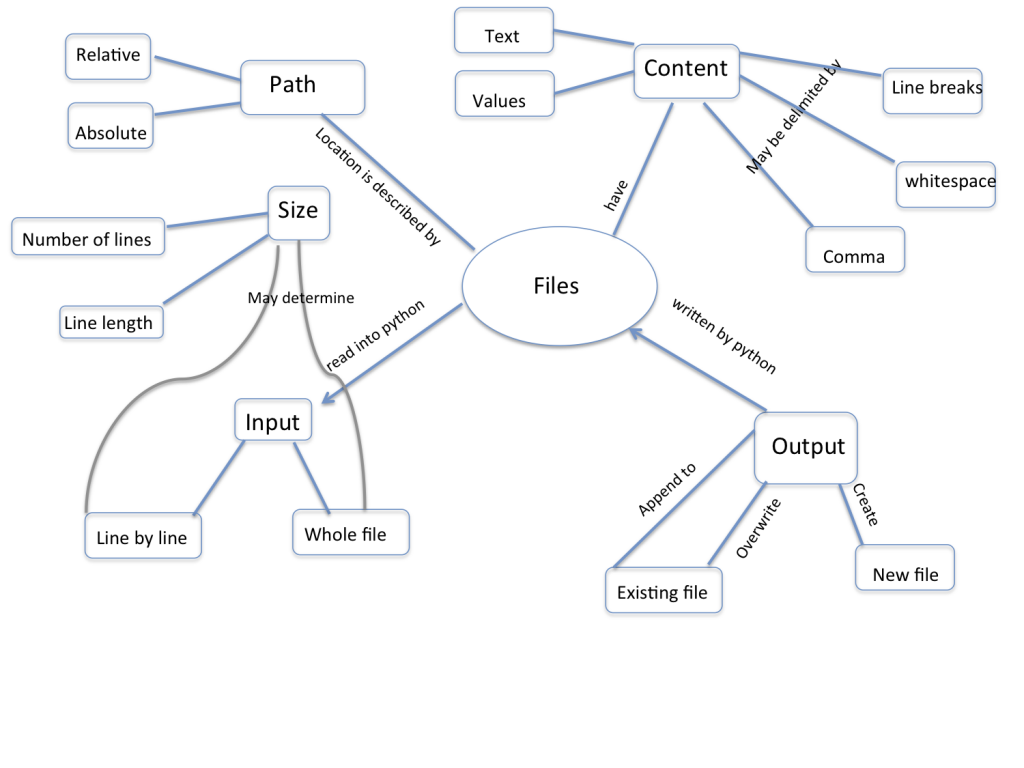
the count rises to 8, which is a good size for a single teaching episode. A few other concept maps drawn by previous participants in this training course are listed below:
- Array Math
- Conditionals
- Creating and Destroying Files
- Sets and Dictionaries in Python
- Input and Output
- Lists and Loops
Most of these are larger than our recommended limit, but that’s not necessarily a bad thing: after drawing a concept map for an entire subject, a lesson designer can then carve out tightly-connected sub-graphs to make individual episodes.
Concept maps can be used in many ways:
- To aid solo design of a lesson by helping authors figure out what they’re trying to teach. Crucially, a concept map separates content from order: in our experience, people rarely wind up teaching things in the order in which they first drew them.
- They aid communication with fellow lesson designers. Instructors with very different ideas of what they’re trying to teach are likely to pull their learners in different directions. Drawing and sharing concept maps isn’t guaranteed to prevent this, but it certainly helps.
- Concept maps also aid communication with learners. While it’s possible to give learners a pre-drawn map at the start of a lesson for them to annotate, it’s better to draw it piece by piece while teaching to reinforce the ties between what’s in the map and what the instructor said. (We will return to this idea below when discussing Mayer’s work on multimedia learning.)
- Concept maps are also a useful formative assessment technique: having learners draw concept maps of what they think they just heard shows the instructor what was missed and what was mis-understood. Reviewing the learners’ concept maps is too time-consuming for use in workshops, but very useful in weekly lectures once learners are familiar with the technique: as Glass observed, any new tool or technique initially slows people down.
Concept maps are also useful for many other kinds of tasks. For example, the next time you have a team meeting, give everyone a sheet of paper and have them spend a few minutes drawing a concept map of the project you’re all working on—separately. On the count of three, have everyone reveal their concept maps simultaneously. The discussion that follows everyone’s realization of how different their mental models of the project’s aims and organization are is always interesting…
Concept maps are also a useful way to organize one’s thoughts before putting together a talk or writing a paper. As with lessons, they allow us to externalize cognition, i.e., to get our thoughts out where we can see them (and see the contradictions that have happily been swimming around inside our heads without bumping into each other).
Concept Mapping
Create a hand drawn concept map for something you would teach in five minutes. (Possibly for the same subject that you used to create a multiple choice question before.) Trade with a partner, and critique each other’s maps. Do they present concepts or surface detail? Which of the relationships in your partner’s map do you consider concepts and vice versa?
Building Concept Maps Together
Concept maps can be used as a classroom discussion exercise. Put learners in small groups (2-4 people each), give each group some sticky notes on which a few key concepts are written, and have them build a concept map on a whiteboard by placing those sticky notes, connecting them with labelled arcs, and adding any other concepts they think they need.
What Are We Doing Again?
Concept maps can also be used to help build a shared understanding of what a project is trying to accomplish. Everyone independently draws a concept map to show what they think the project’s goals and constraints are. Those concept maps are then revealed simultaneously. The ensuing discussion can be…vigorous.
Seven Plus or Minus Two
The Serial Position Effect
Read the following list and try to memorize the items in it:
cat, apple, ball, tree, square, head, house, door, box, car, king, hammer, milk, fish, book, tape, arrow, flower, key, shoe
Without looking at the list again, write down as many words from the list as you can. Compare to other members of the group. What words are remembered the most?
This website implements an interactive version of this exercise.
While the graph model of knowledge is inaccurate but useful, another simple model of knowledge has a sound physical basis. As a rough approximation, human memory can be divided into two different storage layers. The first is called long-term or persistent memory. It is where we store things like our password, our home address, and what the clown did at our eighth birthday party that scared us so much. It is essentially unbounded (barring injury or disease, we will die before it fills up) but it is slow to access—too slow to help us handle hungry lions and disgruntled family members.
Evolution has therefore given us a second system called short-term or working memory. It is much faster, but also much smaller: in 1956, Miller estimated that the average adult’s working memory could hold 7±2 items for a few seconds before things started to drop out. This is why phone numbers are typically 7 or 8 digits long: back when phones had dials instead of keypads, that was the longest string of numbers most adults could remember accurately for as long as it took the dial to go around and around. It’s also why sports teams tend to have about half a dozen members, or be broken down into smaller groups (such as the forwards and backs in rugby).
When we memorize words in a list and are asked to immediately recall them, the words first presented will have the best chance to be transferred into long-term memory. On the other hand, the items that are presented last might still be in short-term memory. These are referred to as the primacy and recency effects, respectively, and they together form the memory serial position effect.
Chunking
Our minds can store larger numbers of facts in short-term memory by creating chunks. For example, most of us will remember a word we read as a single item, rather than as a sequence of letters. Similarly, the pattern made by five spots on cards or dice is remembered as a whole rather than as five separate pieces of information. Chunks allow us to manage larger problems, but can also mislead us if we mis-identify something, i.e., see it as something it isn’t.
7±2 is probably the most important number in programming. When someone is trying to write the next line of a program, or understand what’s already there, she needs to keep a bunch of arbitrary facts straight in her head: what does this variable represent, what value does it currently hold, etc. If the number of facts grows too large, her mental model of the program comes crashing down (something we have all experienced).
7±2 is also the most important number in teaching. An instructor cannot push information directly into a learner’s long-term memory. Instead, whatever she presents is first represented in the learner’s short-term memory, and is only transferred to long-term memory after it has been held there and rehearsed. If we present too much information too quickly, the new will displace the old before it has a chance to consolidate in long-term memory.
This is why it’s very important to use a technique like concept mapping a lesson before teaching it - an instructor needs to identify just how many pieces of separate information will need to be “stored” in memory as part of the lesson.
Key Points
Experts’ mental models are much more densely connected than those of non-experts.
Expert blind spot: knowing something so well that it seems easy when it’s not.
Can represent mental models using concept maps.
Relationships are as important as concepts.
Long-term memory is large but slow, while short-term is fast but (very) small.
Most adults can store 7±2 items in short-term memory for a few seconds before loss.
Things seen together repeatedly are remembered (or mis-remembered) in chunks.
Teaching consists of loading short-term memory and reinforcing it long enough for items to be transferred to long-term memory.
Lesson episodes should not overload short-term memory.