
Intermediate Python
Analyzing Mosquito Data
Introduction
This material assumes that you have programmed before. This first lecture provides a quick introduction to programming in Python for those who either haven’t used Python before or need a quick refresher.
Let’s start with a hypothetical problem we want to solve. We are interested in understanding the relationship between the weather and the number of mosquitos occuring in a particular year so that we can plan mosquito control measures accordingly. Since we want to apply these mosquito control measures at a number of different sites we need to understand both the relationship at a particular site and whether or not it is consistent across sites. The data we have to address this problem comes from the local government and are stored in tables in comma-separated values (CSV) files. Each file holds the data for a single location, each row holds the information for a single year at that location, and the columns hold the data on both mosquito numbers and the average temperature and rainfall from the beginning of mosquito breeding season. The first few rows of our first file look like:
year,temperature,rainfall,mosquitos
2001,80,157,150
2002,85,252,2177
2003,86,154,153
Learning Objectives
- Conduct variable assignment, looping, and conditionals in Python
- Use an external Python library
- Read tabular data from a file
- Subset and perform analysis on data
- Display simple graphs
Loading Data
In order to load the data, we need to import a library called Pandas that knows how to operate on tables of data.
import pandasWe can now use Pandas to read our data file.
pandas.read_csv('A1_mosquito_data.csv') year temperature rainfall mosquitos
0 2001 80 157 150
1 2002 85 252 217
2 2003 86 154 153
3 2004 87 159 158
4 2005 74 292 243
5 2006 75 283 237
6 2007 80 214 190
7 2008 85 197 181
8 2009 74 231 200
9 2010 74 207 184The read_csv() function belongs to the pandas library. In order to run it we need to tell Python that it is part of pandas and we do this using the dot notation, which is used everywhere in Python to refer to parts of larger things.
When we are finished typing and press Shift+Enter, the notebook runs our command and shows us its output. In this case, the output is the data we just loaded.
Our call to pandas.read_csv() read data into memory, but didn’t save it anywhere. To do that, we need to assign the array to a variable. In Python we use = to assign a new value to a variable like this:
data = pandas.read_csv('A1_mosquito_data.csv')This statement doesn’t produce any output because assignment doesn’t display anything. If we want to check that our data has been loaded, we can print the variable’s value:
print data year temperature rainfall mosquitos
0 2001 80 157 150
1 2002 85 252 217
2 2003 86 154 153
3 2004 87 159 158
4 2005 74 292 243
5 2006 75 283 237
6 2007 80 214 190
7 2008 85 197 181
8 2009 74 231 200
9 2010 74 207 184
print data tells Python to display the text. Alternatively we could just include data as the last value in a code cell:
data year temperature rainfall mosquitos
0 2001 80 157 150
1 2002 85 252 217
2 2003 86 154 153
3 2004 87 159 158
4 2005 74 292 243
5 2006 75 283 237
6 2007 80 214 190
7 2008 85 197 181
8 2009 74 231 200
9 2010 74 207 184This tells the IPython Notebook to display the data object, which is why we see a pretty formated table.
Manipulating data
Once we have imported the data we can start doing things with it. First, let’s ask what type of thing data refers to:
print type(data)<class 'pandas.core.frame.DataFrame'>
The data is stored in a data structure called a DataFrame. There are other kinds of data structures that are also commonly used in scientific computing including Numpy arrays, and Numpy matrices, which can be used for doing linear algebra.
We can select an individual column of data using its name:
print data['year']0 2001
1 2002
2 2003
3 2004
4 2005
5 2006
6 2007
7 2008
8 2009
9 2010
Name: year, dtype: int64
Or we can select several columns of data at once:
print data[['rainfall', 'temperature']] rainfall temperature
0 157 80
1 252 85
2 154 86
3 159 87
4 292 74
5 283 75
6 214 80
7 197 85
8 231 74
9 207 74
We can also select subsets of rows using slicing. Say we just want the first two rows of data:
print data[0:2] year temperature rainfall mosquitos
0 2001 80 157 150
1 2002 85 252 217
There are a couple of important things to note here. First, Python indexing starts at zero. In contrast, programming languages like R and MATLAB start counting at 1, because that’s what human beings have done for thousands of years. Languages in the C family (including C++, Java, Perl, and Python) count from 0 because that’s simpler for computers to do. This means that if we have 5 things in Python they are numbered 0, 1, 2, 3, 4, and the first row in a data frame is always row 0.
The other thing to note is that the subset of rows starts at the first value and goes up to, but does not include, the second value. Again, the up-to-but-not-including takes a bit of getting used to, but the rule is that the difference between the upper and lower bounds is the number of values in the slice.
One thing that we can’t do with this syntax is directly ask for the data from a single row:
data[1]---------------------------------------------------------------------------
KeyError Traceback (most recent call last)
<ipython-input-10-c805864c0d75> in <module>()
----> 1 data[1]
/usr/lib/python2.7/dist-packages/pandas/core/frame.pyc in __getitem__(self, key)
2001 # get column
2002 if self.columns.is_unique:
-> 2003 return self._get_item_cache(key)
2004
2005 # duplicate columns
/usr/lib/python2.7/dist-packages/pandas/core/generic.pyc in _get_item_cache(self, item)
665 return cache[item]
666 except Exception:
--> 667 values = self._data.get(item)
668 res = self._box_item_values(item, values)
669 cache[item] = res
/usr/lib/python2.7/dist-packages/pandas/core/internals.pyc in get(self, item)
1653 def get(self, item):
1654 if self.items.is_unique:
-> 1655 _, block = self._find_block(item)
1656 return block.get(item)
1657 else:
/usr/lib/python2.7/dist-packages/pandas/core/internals.pyc in _find_block(self, item)
1933
1934 def _find_block(self, item):
-> 1935 self._check_have(item)
1936 for i, block in enumerate(self.blocks):
1937 if item in block:
/usr/lib/python2.7/dist-packages/pandas/core/internals.pyc in _check_have(self, item)
1940 def _check_have(self, item):
1941 if item not in self.items:
-> 1942 raise KeyError('no item named %s' % com.pprint_thing(item))
1943
1944 def reindex_axis(self, new_axis, method=None, axis=0, copy=True):
KeyError: u'no item named 1'This is because there are several things that we could mean by data[1] so if we want a single row we can either take a slice that returns a single row:
print data[1:2] year temperature rainfall mosquitos
1 2002 85 252 217
or use the .iloc method, which stands for “integer location” since we are looking up the row based on its integer index.
print data.iloc[1]year 2002
temperature 85
rainfall 252
mosquitos 217
Name: 1, dtype: int64
We can also use this same syntax for getting larger subsets of rows:
print data.iloc[1:3] year temperature rainfall mosquitos
1 2002 85 252 217
2 2003 86 154 153
We can also subset the data based on the value of other rows:
print data['temperature'][data['year'] > 2005]5 75
6 80
7 85
8 74
9 74
Name: temperature, dtype: int64
Data frames also know how to perform common mathematical operations on their values. If we want to find the average value for each variable, we can just ask the data frame for its mean values
print data.mean()year 2005.5
temperature 80.0
rainfall 214.6
mosquitos 191.3
dtype: float64
Data frames have lots of useful methods:
print data.max()year 2010
temperature 87
rainfall 292
mosquitos 243
dtype: int64
print data['temperature'].min()74
print data['mosquitos'][1:3].std()45.2548339959
Challenge
Import the data from A2_mosquito_data.csv, create a new variable that holds a data frame with only the weather data, and print the means and standard deviations for the weather variables.
Loops
Once we have some data we often want to be able to loop over it to perform the same operation repeatedly. A for loop in Python takes the general form
for item in list:
    do_something
So if we want to loop over the temperatures and print out there values in degrees Celcius (instead of Farenheit) we can use:
temps = data['temperature']
for temp_in_f in temps:
    temp_in_c = (temp_in_f - 32) * 5 / 9.0
    print temp_in_c
26.6666666667
29.4444444444
30.0
30.5555555556
23.3333333333
23.8888888889
26.6666666667
29.4444444444
23.3333333333
23.3333333333
That looks good, but why did we use 9.0 instead of 9? The reason is that computers store integers and numbers with decimals as different types: integers and floating point numbers (or floats). Addition, subtraction and multiplication work on both as we’d expect, but division works differently. If we divide one integer by another, we get the quotient without the remainder:
print '10/3 is:', 10 / 310/3 is: 3
If either part of the division is a float, on the other hand, the computer creates a floating-point answer:
print '10/3.0 is:', 10 / 3.010/3.0 is: 3.33333333333
The computer does this for historical reasons: integer operations were much faster on early machines, and this behavior is actually useful in a lot of situations. However, it’s still confusing, so Python 3 produces a floating-point answer when dividing integers if it needs to. We’re still using Python 2.7 in this class, so if we want 5/9 to give us the right answer, we have to write it as 5.0/9, 5/9.0, or some other variation.
Conditionals
The other standard thing we need to know how to do in Python is conditionals, or if/then/else statements. In Python the basic syntax is:
if condition:
    do_something
So if we want to loop over the temperatures and print out only those temperatures that are greater than 80 degrees we would use:
temp = data['temperature'][0]
if temp > 75:
    print "The temperature is greater than 75"
The temperature is greater than 75
We can also use == for equality, <= for less than or equal to, >= for greater than or equal to, and != for not equal to.
Additional conditions can be handled using elif and else:
temp = data['temperature'][0]
if temp < 80:
    print "The temperature is < 80"
elif temp > 80:
    print "The temperature is > 80"
else:
    print " The temperature is equal to 80"
The temperature is equal to 80
Challenge
Import the data from A2_mosquito_data.csv, determine the mean temperate, and loop over the temperature values. For each value print out whether it is greater than the mean, less than the mean, or equal to the mean.
Plotting
The mathematician Richard Hamming once said, “The purpose of computing is insight, not numbers,” and the best way to develop insight is often to visualize data. The main plotting library in Python is matplotlib. To get started, let’s tell the IPython Notebook that we want our plots displayed inline, rather than in a separate viewing window:
%matplotlib inlineThe % at the start of the line signals that this is a command for the notebook, rather than a statement in Python. Next, we will import the pyplot module from matplotlib, but since pyplot is a fairly long name to type repeatedly let’s give it an alias.
from matplotlib import pyplot as pltThis import statement shows two new things. First, we can import part of a library by using the from library import submodule syntax. Second, we can use a different name to refer to the imported library by using as newname.
Now, let’s make a simple plot showing how the number of mosquitos varies over time. We’ll use the site you’ve been doing exercises with since it has a longer time-series.
data = pandas.read_csv('A2_mosquito_data.csv')
plt.plot(data['year'], data['mosquitos'])
[<matplotlib.lines.Line2D at 0x7f0dc3da18d0>]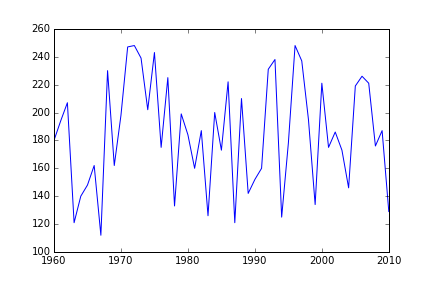
Number of mosquitoes through time
More complicated plots can be created by adding a little additional information. Let’s say we want to look at how the different weather variables vary over time.
plt.figure(figsize=(10.0, 3.0))

plt.subplot(1, 2, 1)
plt.plot(data['year'], data['temperature'], 'ro-')
plt.xlabel('Year')
plt.ylabel('Temperature')

plt.subplot(1, 2, 2)
plt.plot(data['year'], data['rainfall'], 'bs-')
plt.xlabel('Year')
plt.ylabel('Rain Fall')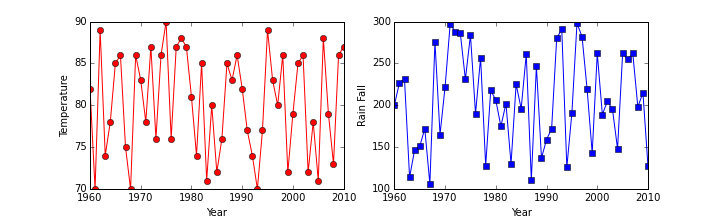
Temperature and rainfall through time
Challenge
Using the data in A2_mosquito_data.csv plot the relationship between the number of mosquitos and temperature and the number of mosquitos and rainfall.
Key Points
- Import a library into a program using
import libraryname. - Use the
pandaslibrary to work with data tables in Python. - Use
variable = valueto assign a value to a variable. - Use
print somethingto display the value ofsomething. - Use
dataframe['columnname']to select a column of data. - Use
dataframe[start_row:stop_row]to select rows from a data frame. - Indices start at 0, not 1.
- Use
dataframe.mean(),dataframe.max(), anddataframe.min()to calculate simple statistics. - Use
for x in list:to loop over values - Use
if condition:to make conditional decisions - Use the
pyplotlibrary frommatplotlibfor creating simple visualizations.
Next steps
With the requisite Python background out of the way, now we’re ready to dig in to analyzing our data, and along the way learn how to write better code, more efficiently, that is more likely to be correct.