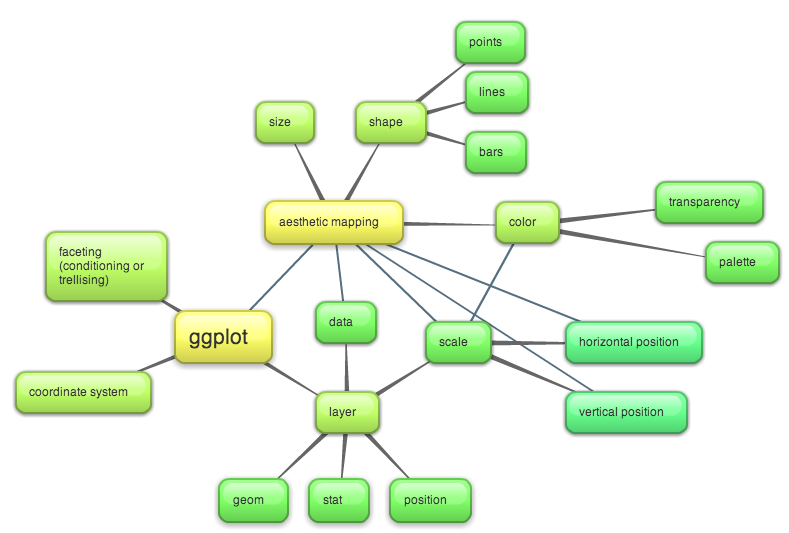
Although I’ve used base and lattice graphics in R for years, I’ve struggled to conceptualize ggplot graphics enough for me to remember the syntax. Using this concept map is the best way I’ve found so far to organize the info, but there are some relationships I haven’t quite worked out yet.
