Topic:
**For my final project, I will give a lesson on data input in R. In R, larger data objects will usually be read as values from external files rather than entered by keyboard. R is fairly strict about how these are formatted, and it is easy to get snagged early in the learning process. The purpose of this lesson is to clear up data input so the beginner user can get started with analysis with R.
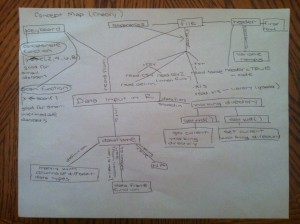
Concept Map:
**When creating a concept map for this topic, it helped to have both a map for how all the concepts relate and for an example workflow of data input in R. The concept map can me used for teaching theory and the workflow map can be used for an idealized data input exercise.
Assessment Questions:
1) Why is using attach not good practice, and what are some alternative ways to access your data in R?
Attach can mask variables. Other ways to access variables are through dataframe$variable and using with.
**2) How is a dataframe different than a matrix (in R)?
Values in the body of a matrix can only be of one type, whereas values of a dataframe can be numbers, text, dates, or logical variables.
Presentation Slides: Data Input in R:
These slides will be paired with a demo that will include copy/pasting into the scan function, formatting Excel data for input in to R, and a simple example of using the read.table function to input a .txt file into R.
Feedback on Presentation:
**I gave my presentation to April Wright and Emily McTavish, both Software Carpentry Instructors. Overall, they said that the presentation went smoothly and they liked it, but they had some helpful advice to polish it up.
- don’t use “data” as a variable in an example—although it’s not a reserved case in R, it is in other languages
- emphasis getwd() to check for current working directory, as this is a common problem with beginning students: emphasis that they should check where they are and demonstrate that the working directory is changed after I change it
- explain in more detail why spaces are problematic with how R reads in files
- explain in more detail why experimental units need to be in their own row (in terms of how R reads in data)

