Description:
I’m going to demonstrate the following for my final project:
- Open IPython notebook
- Read csv with Pandas
- Plot different columns with Pandas/matplotlib plotting in notebook
- Save notebook to static HTML to share with others
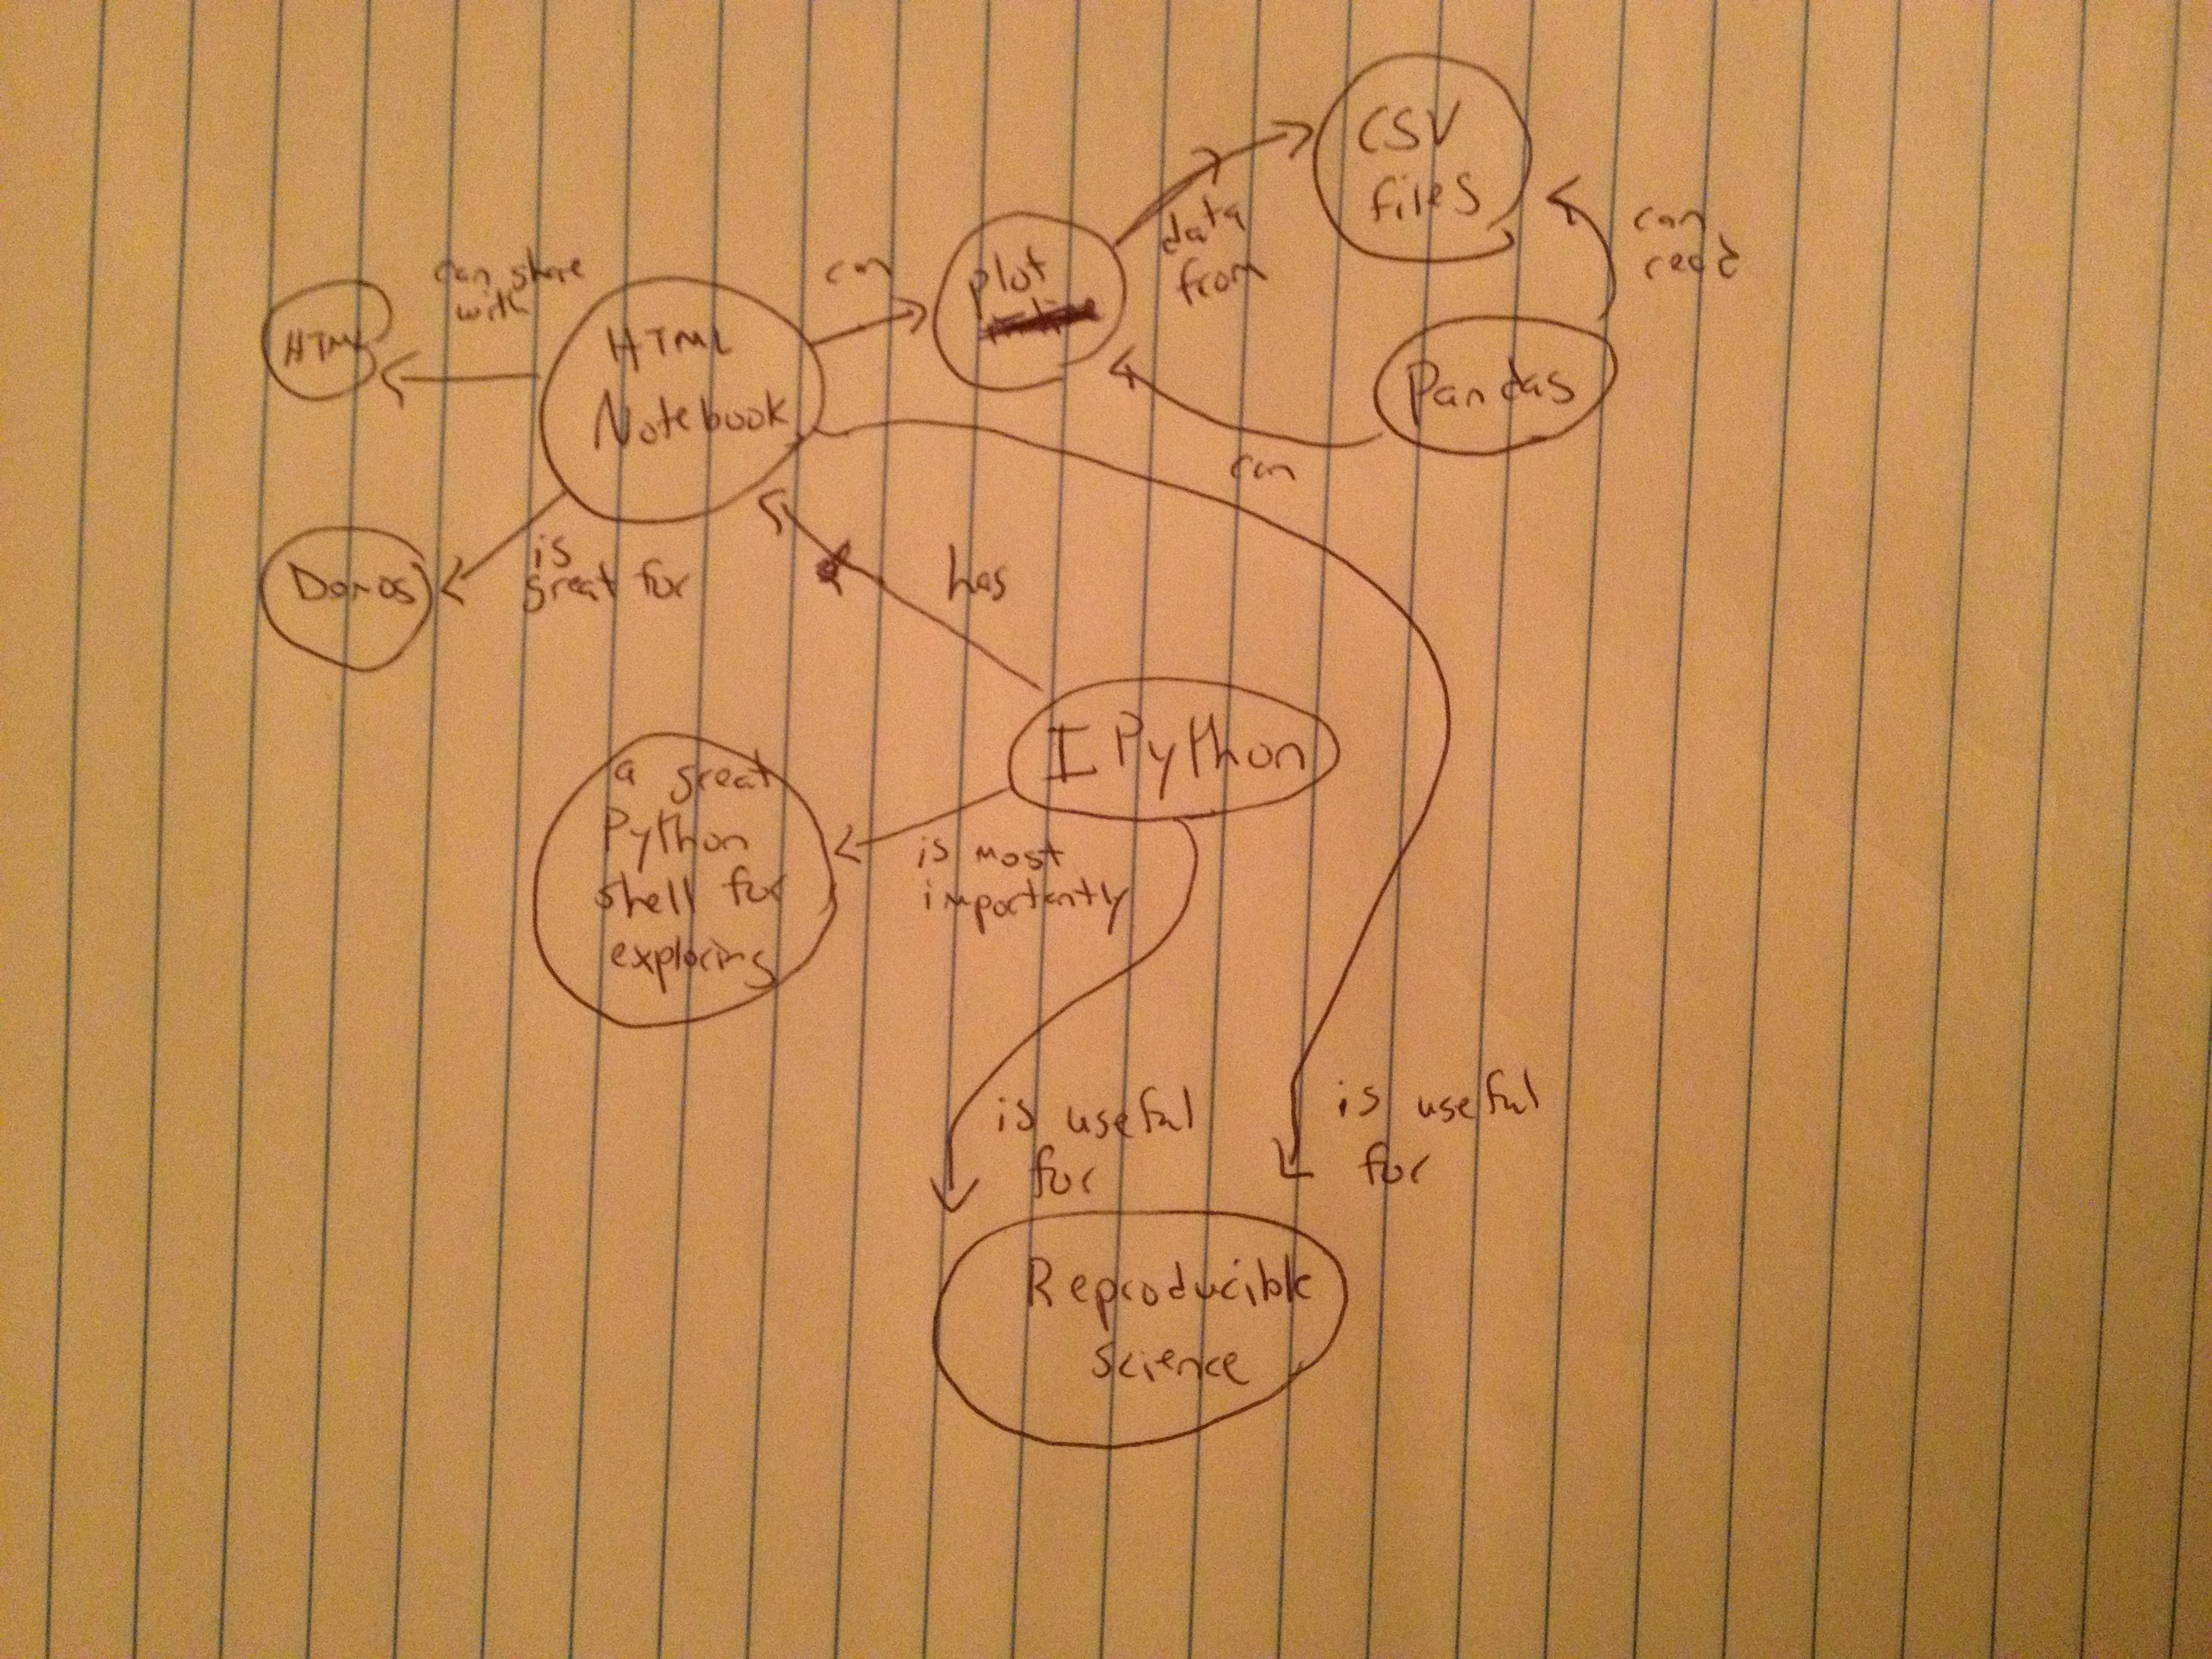
Concept Map:
Assessment Questions:
- Which scenarios are best for using the IPython project:
a) Exploratory programming
b) Showing code and plots in HTML
c) Reproducible science
d) All of the above
- Pandas is a good tool for:
a) Debugging Python code
b) Analyzing existing data
c) Creating highly interactive data plots
d) None of the above
Teaching materials
I used a single IPython notebook for this exercise. I also used http://wakari.io to demonstrate how to run all the code without installing anything locally. I can share the raw notebook with details if anyone is interested. However, the HTML version of my notebook is available here: http://nbviewer.ipython.org/6369273
Feedback
The feedback I received was varied because of the experience of participants. I was told that I spoke a bit too quickly and covered too much material in the amount of time. However, I also heard that I repeated myself too much and mentioned key items over and over.
I tried really hard to be enthusiastic when teaching this topic because it’s interesting to me. However, I think the example I chose, my own fitness data, didn’t seem to excite people if they didn’t already collect their own data. I thought that parsing the CSV would get people excited about the possibilities, but people seemed to attach to the idea that it was just fitness data and not useful for them despite the underlying concept. So, I think I would pick a more universal example next time that might connect better with students.
Also, question 1 was relatively easy for everyone. However, question 2 seemed to trip up beginners because the differences between matplotlib and Pandas are very blurry in my examples. So, newcomers couldn’t decide whether Pandas was good for plotting or data analytics. I suppose both are sort of correct, but the answer I was looking for was ‘b’, not ‘c.’