This assessment will be given after a short introduction to summarising data in R. The introduction will cover only summarise and ddply from the plyr package.
In the following questions we will be using the Seatbelts dataset in R. The dataset gives the monthly totals of car drivers in Great Britain killed or seriously injured Jan 1969 to Dec 1984.
You may import the dataset in R by using the following commands:
data(Seatbelts)
Seatbelts <- data.frame(Year=floor(time(Seatbelts)),
Month=factor(cycle(Seatbelts),
labels=month.abb), Seatbelts)
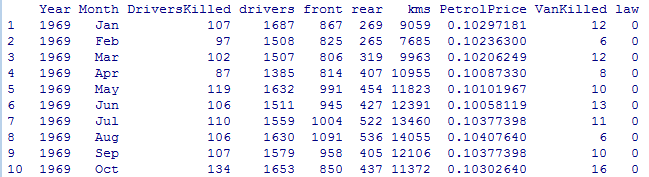
The dataset (first 10 observations) should look like this:
a.) ddply(Seatbelts, .(Month), summarise, total.killed=sum(DriversKilled))
b.) ddply(Seatbelts, .(Month), summarise(total.killed=sum(DriversKilled)))
c.) ddply(Seatbelts, .(Month), total.killed=sum(DriversKilled))
d.) ddply(Seatbelts, .(Month), sum(DriversKilled))
2. Calculate the following items:
before and after the seat belt legislation was introduced (as indicated by the variable law). Your output should look like the following:
![]()
FYI: Compulsory wearing of seat belts was introduced on 31 Jan 1983.